The data, and what is wrong with it
Ragged histories, bad prints, survivorship bias, and the benchmark that is lying to you.
Before any maths, look at the data carefully. This module has almost no formulas in it, but it is the habit that stops you producing confident nonsense later on.
Download the raw workbook and open the
Prices tab.
Use the raw file for this module, and only this module
That link gives you the panel as it arrives from the data provider: all 100 names, ragged start dates, real gaps, and the bad prices still in. The later files have already been cleaned, so this is the only one where you can practise finding the problems.
From Module 2 onward, switch to the core workbook. That is the same data after we have made the decisions you are about to make, trimmed to a tidy rectangle. Everyone works from the same file after this, because otherwise no two people's answers would agree.
1. Ragged histories
You have 100 FTSE 100 constituents, but not 100 complete price histories.
Sort the Universe tab by the first_date column. Some names go back to 1995.
Nine started after 2015. One of them, Metlen, which joined the index recently,
has barely a year.
You need to decide how to handle this, and there is no single correct answer:
- Keep every name and your covariance matrix can only span the shortest history. That is about thirteen months, which leaves out every crisis in the sample.
- Keep the long window and you must drop the short names, losing real companies from the model.
- Something in between, which is what most people do.
Doing it in Excel
Have a look at the Prices tab. As you scroll along the top rows from left
to right, you will find some price histories that do not begin until later
and so are blank at the top.
If you want to see how much history each stock has, try using the COUNT
command to tell you — put it in a spare row above the prices and drag
it across. You can then sort or filter on that row.
When you decide to reject a column, delete it rather than leaving it in with gaps at the top. Blank cells get read as zeros later on, and a zero return is not the same thing as a missing one.
We offer three files on the data page: Raw (this one), Core from 2005, and Long from 1995, which keeps a longer history at the cost of roughly a quarter of the names. Have a look at all three and see what each choice costs you.
2. Bad prices
Free data contains errors. Here is an example from this dataset: Polar Capital Technology Trust, over four consecutive rows of the file:
| Date | Price (p) |
|---|---|
| 2011-04-27 | 371.90 |
| 2011-04-28 | 373.50 |
| 2011-04-29 | 37.35 |
| 2011-05-03 | 377.30 |
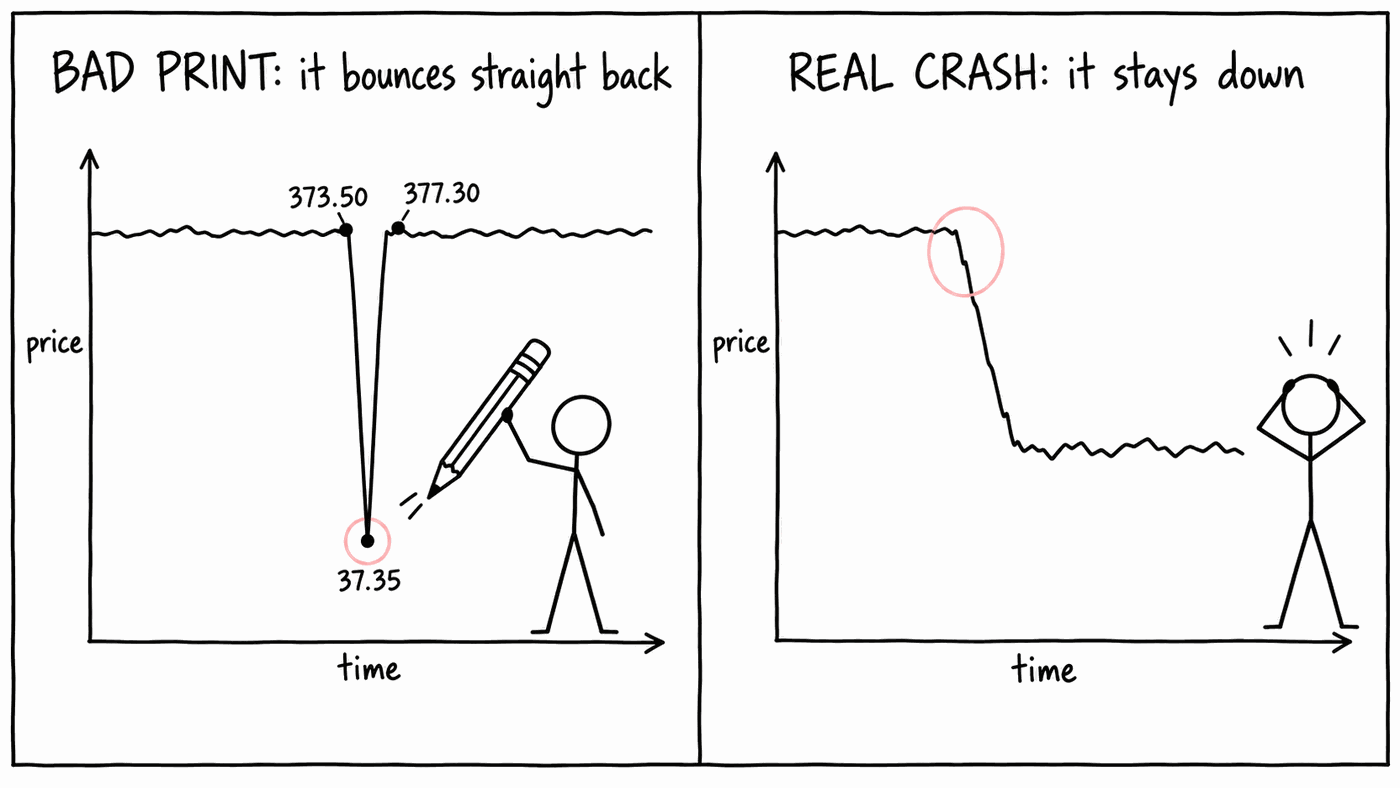
The price falls by a factor of ten for one day and then recovers. As a return series that is −90% followed by +910%. In a covariance matrix that gives the stock an annualised volatility of about 285%, and because it is so volatile it dominates the results. When we first ran a principal components analysis on the uncleaned panel, this single stock accounted for half of the first principal component. The "market factor" was one broken investment trust.
The same name also has breaks that do not reverse: on 2013-01-02 it drops from 363.50 to 37.43 and stays there.
Your task
Hunt them.
Build a new returns tab with the daily returns for each stock over time.
Technically quants prefer the log return, =LN(B3/B2), but pretty much everyone
just does =B3/B2-1. Either is fine for finding outliers.
An Excel trap worth knowing now
Excel's LOG function is base 10. The natural log, which is the one you want
for a log return, is LN. LOG(B3/B2) returns a plausible-looking number
that is wrong by a factor of about 2.3.
Then use conditional formatting to flag any absolute daily move above, say, 40%. Look at each one and decide which kind it is:
- A real market event. Barclays genuinely rose 73% on 26 January 2009. RBS genuinely fell 67% on 19 January 2009. Keep these; they are among the most informative days in the sample.
- A bad print that reverts. Delete and interpolate.
- A permanent scale break. Usually an undeclared corporate action. Without a corporate-action feed you cannot safely repair these, so drop the name.
Bank holidays
Many of the bad prints in this panel fall on Christmas Day, Good Friday and the May Day bank holiday, when the London Stock Exchange was shut. The data provider records a value anyway. This is also why, from the next module onward, we sample weekly returns Wednesday-to-Wednesday: UK holidays cluster on Mondays and Fridays. In this dataset, Wednesday sampling lands on a non-trading day 10 times, Friday 32 times, and Monday 106 times.
When you are done, compare your list against our cleaning log — either on the data page or as a CSV. We repair and exclude using published rules, and other people might reasonably draw the line in slightly different places.
3. Survivorship bias
These are today's FTSE 100 members, with their history backfilled.
The file does not include companies that have since left the index, such as Northern Rock or Carillion, or RBS at its pre-crisis size. Companies usually leave the index after doing badly, so the sample is made up of survivors.
The effect is large. Over the 2005-onward window:
| Series | Annualised return |
|---|---|
^FTSE (real FTSE 100, price only) |
+3.8% |
CAPFIXED_TR (our composite, total return) |
+9.0% |
Some of that gap is dividends, at roughly 3.5% a year. Most of the rest is survivorship bias, worth about 2 percentage points a year of entirely fictional return.
What this does to your risk numbers
It makes them look better than they should. Companies that failed are missing, so volatility, and tail risk in particular, are understated. A production risk system uses point-in-time constituents. We cannot do that here, so it is worth mentioning whenever someone quotes a backtest built on current index members.
4. The benchmark that is lying to you
Open the Benchmarks tab.
These are the top-level prices of other benchmarks, besides the FTSE 100 that we
are digging into. In each case we are just looking at the combined value of the
index — a single number per day — rather than breaking it out into
all the component stocks as we have done on the Prices tab. You will see later
how these become useful, in the time-series section of the tutorial.
A key distinction is whether these total levels account for dividends or not.
An index can be quoted two ways. A price index tracks only the share prices of its members. A total return index assumes every dividend is reinvested back into the index. Over twenty years the difference compounds to a large amount, so it matters which kind of series you compare against.
Two of the series look as though they should be identical:
ISF.L— iShares Core FTSE 100, distributingCUKX.L— iShares Core FTSE 100, accumulating
Same index, same manager, same underlying holdings. The only difference is what the fund does with the dividends it receives: the distributing share class pays them out to you as cash, and the accumulating one reinvests them inside the fund.
Compute the annualised return of each, over the period where both exist.
You should find CUKX.L beating ISF.L by around 3.7% a year, which is the FTSE
100 dividend yield. The accumulating share class reinvests dividends inside the
fund, so its price is a total return. The distributing one pays them out, and our
data provider's "adjusted" series does not add them back. ISF.L tracks the
price index to within 0.1% a year.
When you regress a stock against "the market" in Module 7, use CUKX.L.
Regressing total returns on a price index biases your alphas down by roughly the
dividend yield.
Keep this in proportion
Dividends matter a lot for returns and very little for risk. Volatility
is a second moment, and a smooth 3.5% a year yield barely affects it.
Measured on this data: CUKX.L annualised vol is 15.322% and ISF.L is
15.336%, a difference of 0.014 percentage points. So if you only have
price returns, your volatility estimate is fine. Do not let anyone tell you otherwise.
5. Currency, hiding in plain sight
Three names in the FTSE 100 are not quoted in sterling: Compass and IHG in US dollars, and Metlen in euros. We have converted them to pence so the file is consistent. As a result, their return series contain an unhedged FX move as well as the stock move. For a sterling investor that is part of the risk. If you are analysing the business itself, the currency move is noise, and production risk systems usually separate the two.
What to take away
- Look at the data before you model it.
- Distinguish a real market move from a bad print; the test is whether it reverts.
- Know which biases you are accepting, and mention them.
- Check what a benchmark series actually measures before using it.
Check your answers
Sign in to get your own portfolio and have your answers marked.